 MBLogic
for an open world in automation
MBLogic
for an open world in automation
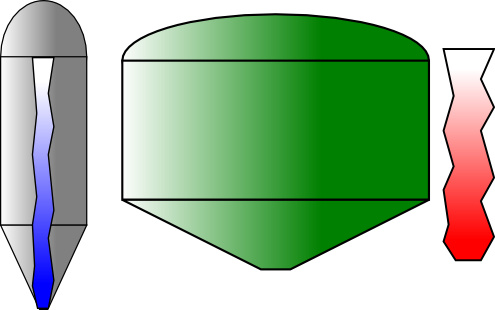
Column Level Output Objects
Column level outputs use the position of a sharp contrast between two colours to indicate a relative value. These consist of column gauges (intended as display instruments) and tanks (intended to represent process tanks or hoppers). Column gauges and tanks function in identical ways, and only differ in their physical appearance.
Column level output objects manipulate the values in a colour gradient. The transition between the middle two gradient "stops" is abrupt (the stops are set to the same value), so the transition is a sharp line instead of a gradual shading of one colour into another. In their default state they show a gradual shading (a "misty" appearance), but when activated by the correct library function the line becomes sharp.
Column level objects are different from all the other objects described here in one very important way. As well as being provided in a variety of pre-defined colours, a number of columns of each colour are also provided, with each one being individually numbered.
The reason for this is that it is the gradient definition that is being manipulated, rather than the object itself. You can only use each column once independently in each drawing. If you attempt to use the same column more than once, the results may not be predictable. The most likely result is that the duplicate column may be be linked to the original and move together with it. However, this is not guaranteed and this behaviour should not be counted on.
If you need more independent column objects of the same colour than have been provided, then you will need to create additional ones by modifying copies of the ones provided. See the section on user created graphics for information on how to do this.
Column Gauges
Column gauges consist of a gauge background which is simply a passive background object, plus a column indicator with a colour transition line which moves vertically indicate a relative value.
- Drag a column gauge background onto the screen.
- Drag a column indicator onto the screen and position it on top of the gauge background.
You do not need to set the "id" properties or any other values. These are pre-defined for each column. You may optionally set the "id" to make navigation in the XML editor easier.
If you wish to confirm the name of the gradient used by a column:
- Select the column indicator.
- Open the XML editor ("Edit", then "XML Editor").
- You should see the "style" attribute for the column. The properties for this will include "fill". The fill parameter will show the name of the gradient being used (e.g. fill:url(#GaugeFillBlue_0);). You can use this name to determine the names of the stops (see below).

Tanks
Tanks consist of a tank background which is simply a passive background object, plus a tank fill indicator with a colour transition line which moves vertically indicate a relative value.
- Drag a tank background onto the screen.
- Drag a tank fill indicator onto the screen and position it on top of the tank background.
You do not need to set the "id" properties or any other values. These are pre-defined for each tank fill indicator. You may optionally set the "id" to make navigation in the XML editor easier.
If you wish to confirm the name of the gradient used by a tank:
- Select the tank fill indicator indicator.
- Open the XML editor ("Edit", then "XML Editor").
- You should see the "style" attribute for the tank fill indicator. The properties for this will include "fill". The fill parameter will show the name of the gradient being used (e.g. fill:url(#TankFillBlue_0);). You can use this name to determine the names of the stops (see below).